Azure Stack HCI is available in different offers but at the end of the day this is a packaged, hardened, Azure boosted version of Windows Datacenter/Hyper-V.
It is not only to run Virtual Machines OnPrem, but you can also run natively some Azure services such as Kubernetes.
Has its DNA is hybrid, the “Windows Admin Center” (local admin portal) natively propose a lot of Azure native services that you can leverage directly from HCI.
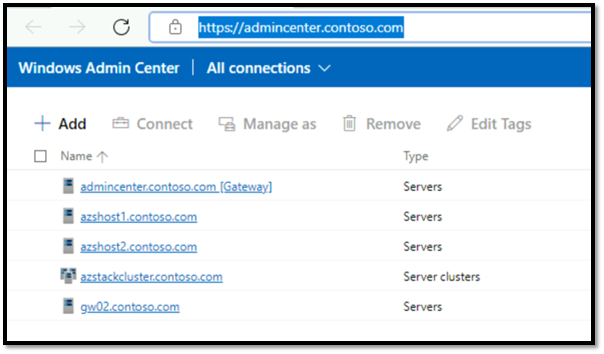
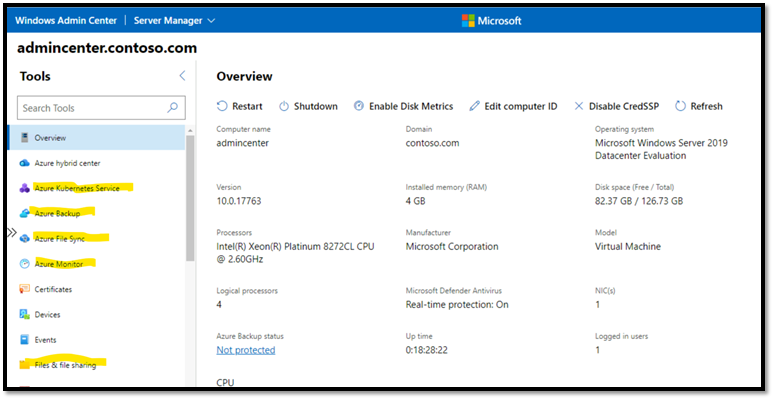
As a result of this integration with Azure, when we need to set up Monitoring, we just need to leverage native technologies such as Log Analytics, Monitor, and query language such as Kusto.
Let’s focus now on monitoring and see how it is integrated natively with Azure.
Monitoring Azure stack in the Azure Portal: First, Azure Arc “HCI” section
As you can see below, we are on the Azure Arc part of the portal. You can see at the left all the scenarios that we have available in Azure.
Azure Stack HCI is one of them (also VMware, Servers, Kubernetes .. ) and if you pick one of them, it will show you the details.
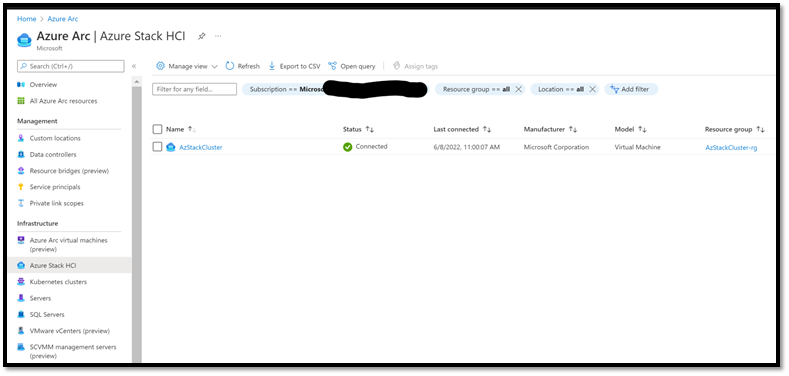
If you click this cluster, the GUI will zoom in, and show you more details especially:
- Deeper info regarding the cluster: Health, name, Version, size
- Details regarding the nodes: (health, model, Serial number, etc.
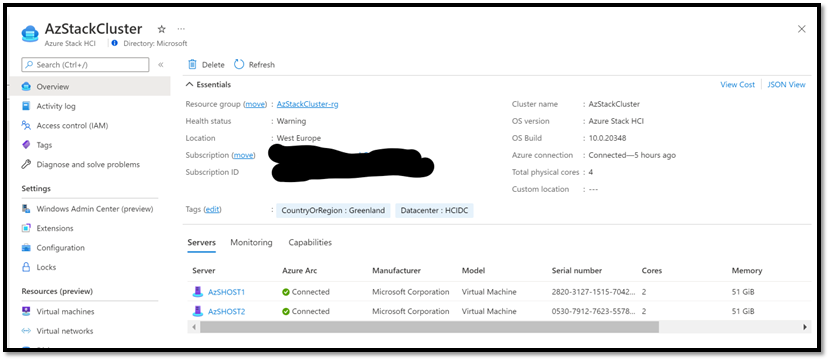
Finally, if you click a cluster, you will get more details. Note the “Nodes/Monitoring/Capabilities” horizontal menu that you could miss.
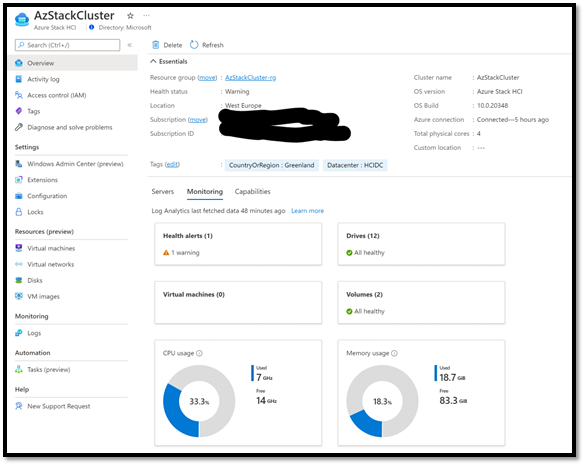
Monitoring Azure stack in the Azure Portal: Second, Azure “monitor” section
At this level, we have “high level” information regarding the health of the cluster.
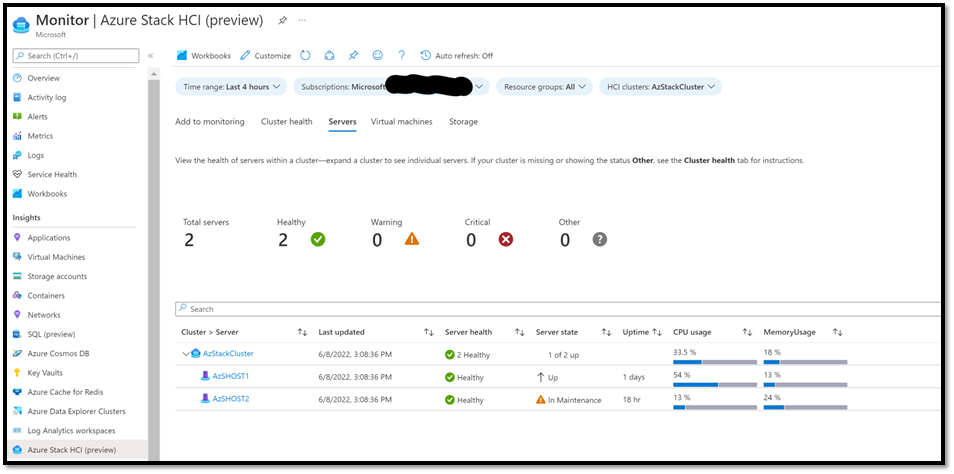
If you experience some problems to see the data, make sure that you missed nothing in the install procedure(Monitor multiple server clusters with Azure Stack HCI Insights – Azure Stack HCI | Microsoft Docs)
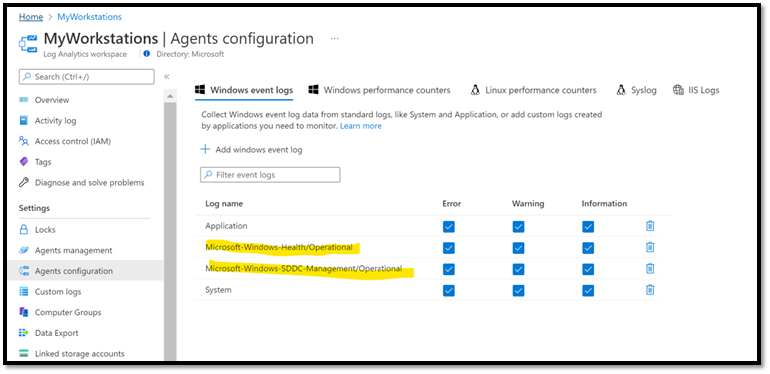
Especially, make sure that you retrieve 2 event folders via Log Analytics agent:
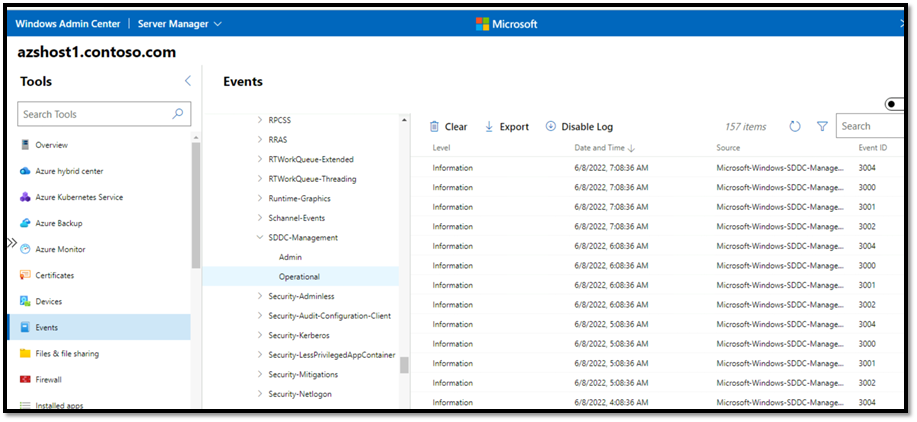
You can also see these events in the WAC console here:
Going deeper: Leveraging Kusto and workbooks
As usual, all this data is in a Log Analytics workspace, and we can leverage Kusto Queries in workbooks.
On the screenshot below, I have re-created part of what you have seen in the natural HCI portal. As you will see it is an interesting exercise in Kusto.
As you can see in this example, I am investigating Node 1 of my cluster, and get his name, if it is connected, who is the manufacturer (HP, Dell… Here you see Microsoft as it is a nested VM), Serial number etc.

How Kusto Works: deeper example
It is interesting to look at the Kusto query as we have a few challenges, especially with Json columns.
To experiment with this, run this 2-lines request. As you can see we query Azure (not log analytics) to list of HCI Clusters.
Look at what we get from the GUI.
In the list of fields exposed by Ressources, we especially get one called PROPERTIES. If we click it, the portal shows us the details (at the right of the screenshot) as it is not a simple “value”, but a JSON one, so need to extract this data from JSON.
First of all, this PROPERTY field contains multiple sub fields (Status, BillingModel, etc).
Note that we have another JSON Field, desiredProperties with interesting information.

So now we will look at the full query and see how to challenge such scenario (read Json, extract part of Json).
Resources
| where type==”microsoft.azurestackhci/clusters”
| extend Properties = parse_json (properties)
| extend RProperties=parse_json (Properties.[‘reportedProperties’])
| extend Node0=parse_json (RProperties.[‘nodes’][0])
| extend Node1=parse_json (RProperties.[‘nodes’][1])
| extend Node2=parse_json (RProperties.[‘nodes’][2])
| extend Node3=parse_json (RProperties.[‘nodes’][3])
| extend Node4=parse_json (RProperties.[‘nodes’][4])
| extend Node5=parse_json (RProperties.[‘nodes’][5])
| extend Node6=parse_json (RProperties.[‘nodes’][6])
| extend Node7=parse_json (RProperties.[‘nodes’][7])
| extend Node8=parse_json (RProperties.[‘nodes’][8])
| extend Node9=parse_json (RProperties.[‘nodes’][9])
|project name, type, location, properties, tags, Properties.provisioningState, Properties.status, RProperties.clusterName, RProperties.clusterVersion, Properties.trialDaysRemaining, Node0,Node1,Node2,Node3,Node4,Node5,Node6,Node7,Node8,Node9
The first yellow line shows you how to use the property field, and then, how to extract parts one by one. In our example, we extract one node of the global cluster.
“Nodes query”
Now we know how to extract Json, we just need to inject the Cluster ID pre-selected in the Listbox.
Resources
| where type==”microsoft.azurestackhci/clusters”
| extend ClusterProperties = parse_json (properties)
| extend RClusterProperties=parse_json (ClusterProperties.[‘reportedProperties’])
| extend TheNode=parse_json (RClusterProperties.[‘nodes’][{NodeID:label}])
|project name, ClusterProperties.status, ClusterProperties.lastSyncTimestamp, TheNode, TheNode.id -1, TheNode.name, TheNode.osName, TheNode.manufacturer,TheNode.model, TheNode.serialNumber, TheNode.coreCount, TheNode.memoryInGiB, TheNode.windowsServerSubscription
In my scenario, NodeID is the name of a list box I have created and put just before the query. Of course, I prepopulated the data with 0,1,2…
Exploring deeper: how to retrieve HP data
<TBD with HP team>
Version 1.0