As I mentioned in my other Posts, Azure Arc has been introduced by Microsoft to break the silos in the infrastructure.
Especially in multi on prem/multi cloud scenarios, IT Pros have difficulties managing such spread out architecture as they are built with different solutions.
By silo I mean different tools, procedures, skills for each Cloud, etc. The risk is also to have teams specialize on one cloud, creating also some silos in the organization.
In this article I would like to show you a quick step by step demo of Arc, how to deploy it, and what you get instantly.
Note: what you see below is usually deployed in 30 mn and can cover instantly as many machines as you want.
Step 1: Activate Azure Arc backend
You just need to go in the Azure Portal, and search for Arc.
On this screenshot you see in the “infrastructure” section all the scenarios we can address with Arc:
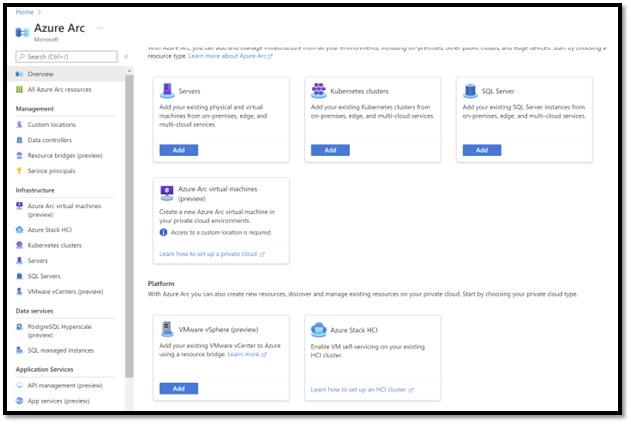
HCI, K8S, Servers, SQL Vmware … all these scenarios “outside” of Azure can be covered. As a result, all these infrastructures will be centrally visible and managed.
The easiest way to start the discovery of Arc is with the Server scenario as we have usually a great experience on this area, and the challenges it implies.
Step 2 : register your external servers in Azure Arc
There are a few options to register a server, but to understand how it works behind the curtain the best way is to select the Script option.
It will ask you a few questions and generate a PowerShell script that will download the agent and register the machine at the right place and right parameters.
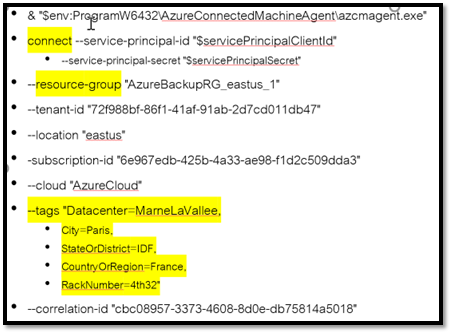
First, I would like to explain a bit more parts of that script. On this extract you can see different things.
- “CONNECT” is the verb used to register the machine.
- “Ressource Group” is where the machine will be registered. As a result, you will see the icon of the server, with a “circle” underneath meaning that it is an external (Arc) machine.
- Tags are “markers” that you can put on the projection of the server to give more context. In this example the city, the Region (Ile de France), The country and even the rack number. As a result, you will be able to query this information later on.
Here is the extract of the Script I’d like to focus on:
We suppose now that you have executed this script on 1 or multiple windows machines (it works of course also on Linux).
Let’s see the result after this 3 seconds work.
Step 3: Arc agent installed : what do you get already ?
3.1 – See all your machines as if they were native Azure machines.
The machine has successfully registered in Azure, and we can see their icon in the Azure Portal.
Value: After just a few seconds installing the agent, you get the first benefit: the machines are visible in the Azure portal.
… but let me rephrase this “all your machines, no matter where they are located, will be seen the same way in the Portal, with the same experience”.
Below you can see all the machines.
We can then click one, and we get the Azure Portal GUI with all the details (security, policy, logs…) and of course the tags:
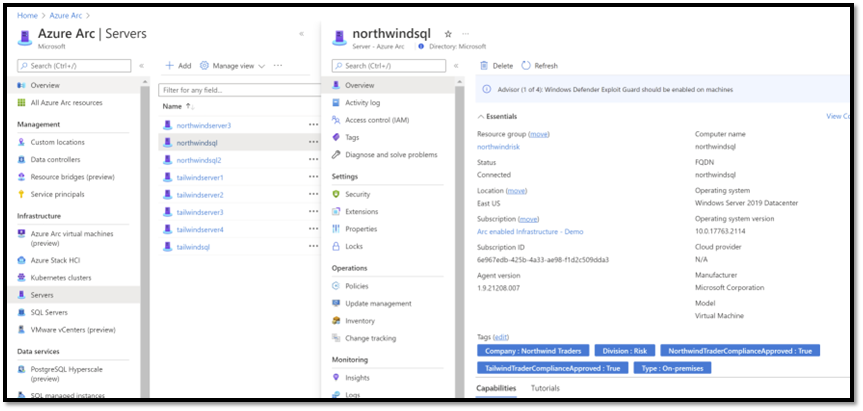
This GUI will be the same for all your machines no matter where they are: On prem, Google, AWS, HCI, Vmware.. Etc. Isn’t it great?
3.2 – Already leverage the tags
Part of this script, we created some tags that will be part of the metadata of the machine. If you recall: city, country, rack number, etc.
These tags are visible in the Azure Portal (check previous screenshot). But let’s go further.
Part of Azure Portal you can create reports called “workbooks”.
We can easily query the machines, extract the tags, and display them on the screen.
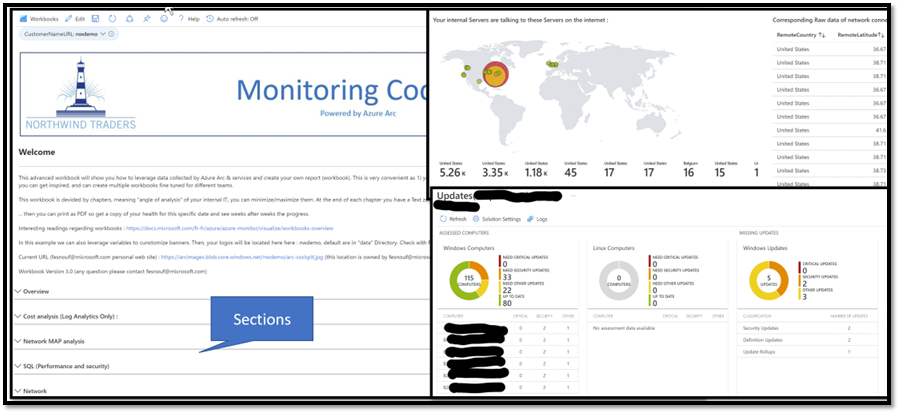
Below is an example where we use the country name of the machine and display them either on a MAP visualization, or just in a TAB.
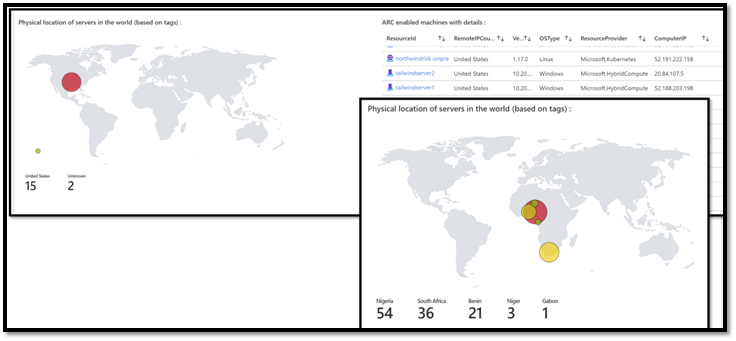
Note that in the raw data, the Arc agent also gathers some very interesting formation such as agent version number, IP, OS type, etc.
Step 4: Policy driven management: Let’s the magic begin!!
Now that the machine has registered in Azure Arc, we assume that the team has previously created policies.
Policies are descriptions that explain how a machine should be managed, no matter where it is located (leveraging Azure Arc).
As an example, we may say that “all windows machines must have Azure log analytics agent + the extension”.
Below we are in aAzure Portal, Policy sections, and activated 2 policies, one for each component.
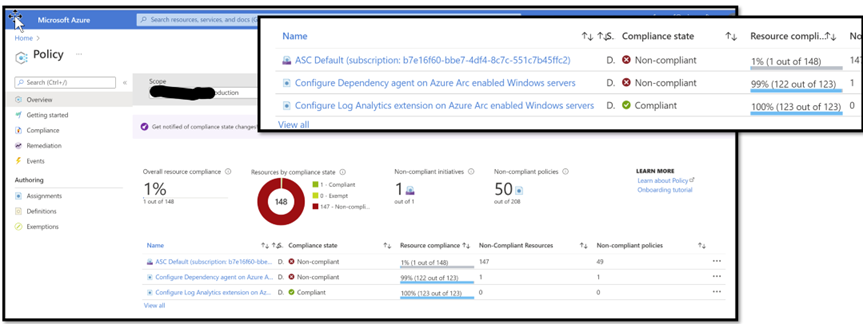
We can see here that there are 2 policies, one for LA agent and one for the Dependency agent. We see that 123 machines have been assessed (in my lab, all of them have Arc agent)
As a result of this, we know that 122 machines are fully compliant, which means that they have received the components, and now they are monitored by the solution.
Step 5: Log analytics and subcomponents
For those of you who are not familiar with Log Analytics, this product is at the same time a repository to store data (many products such as sentinel use it for this) but also an application where you can activate some very interesting features: Capture performance counters, event log, security solutions such as AD and SQL. This requires just a 5mn to configure what we want to gather, then, all the machines running the agent will comply with this policy.
On the side of Log Analytics, other components such as automation can do important things such as software inventory, change management, patch management. We assumed here we also have activated automation.
At this level, the policy is enforced. Log analytics and automation start to work, and the solution captures data on the remote machines, and stores this raw data in the log analytics workspace.
Then There are then a few options to see the result (the data):
- In the Azure Portal, either centrally by clicking a machine, or by selecting one specific feature for example patch management, or insights.
-
By creating a Workbook, with Kusto queries, that will query the logs and display the result that you explicitly need.
Step 5: how to see all this data in your custom report (workbooks)
Even if we see all the data captured “rendered” in the Azure Portal, sometimes it is interesting to create its own report and extract what you really want.
For example, you could have a report called “daily checks” where you will look only at the top 15 metrics you really want to see every day.
Or, you could even have one workbook for the Security Team, another for the Network Team, etc.
- A report is just a stack of individual Kusto Queries that you run against the raw data captured and stored in log analytics.
You can also create “sections” to regroup queries related to the same topic. For example, “all queries regarding network”.
Good news, you don’t have to start from scratch! and spend hours learning Kusto!!
- To save some time, you can upload a big-preconfigured workbook in just a few seconds (see other post regarding this topic, and how to).
As a result, you will have a nice report, with the colors of the companies, with a lot of sections and great Kusto queries.
If you want to dig in Kusto and leverage this sample report, click this link: <TBD>
Version 1.0